Monitoring the climate is a standard project for the RaspberryPi. I bought two Raspberry Pi Zero, two BME680 Breakout, booted my old Raspberry Pi 3 and started hacking.
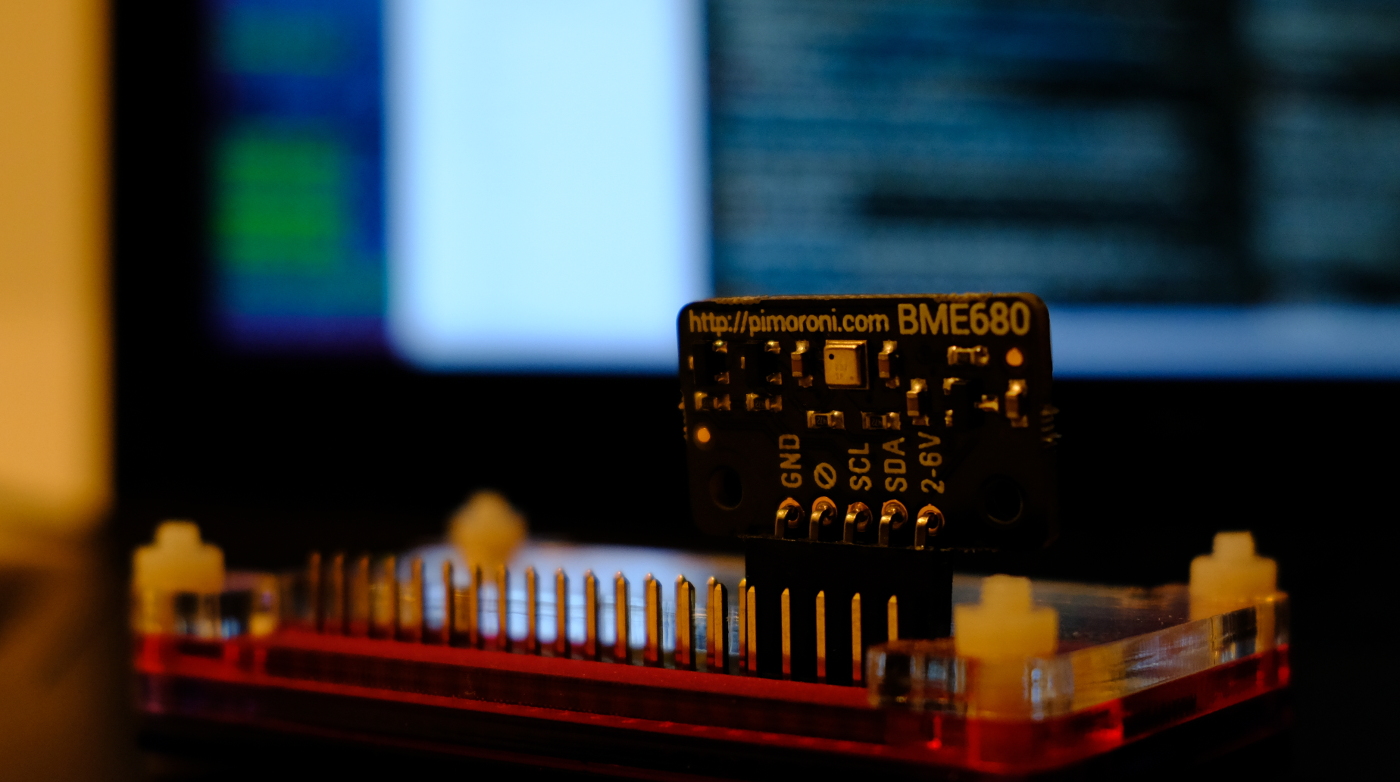
Testing the BME680 module
To start on working with the BME680 module I can highly recommend the BME680 python lib and the tutorial. Just follow the instructions from the tutorial to test your sensor.
Failstory - Install Elasticsearch on RaspberryPi
TLDR; Elasticsearch on Raspberry is not possible.
At first I tried to use ElasticSearch for aggregating the sensor data. I followed an old tutorial for the Pi. Unfortunately Elasticsearch v6 needs at least 8gb of RAM. Otherwise the Java Virtual Machine won’t start.
However if you want to send BME680 data to Elasticsearch you can use the following elasticsearch mapping:
curl -X PUT "192.168.178.54:9200/klima" -H 'Content-Type: application/json' -d'
{
  "mappings": {
    "sensors": {
      "properties": {
        "device_id": { "type": "string" },
        "temperature": { "type": "float" },
        "pressure": { "type": "float" },
        "humidity": { "type": "float" },
        "datetime": {
          "type": "date",
          "format": "yyyy-MM-dd HH:mm:ss||yyyy-MM-dd HH:mm:ss.SSS"
        }
      }
    }
  }
}
Then you can parse BME680 data and send it to an elasticsearch endpoint with:
#!/usr/bin/env python
import bme680
import time
import json
import requests
import datetime

sensor = bme680.BME680()


def get_raspid():
    # Extract serial from cpuinfo file
    cpuserial = "0000000000000000"
    with open('/proc/cpuinfo', 'r') as f:
        for line in f:
            if line[0:6] == 'Serial':
                cpuserial = line[10:26]
    return cpuserial


delay_s = 6
url = 'http://192.168.178.54:9200'
index = 'klima'
group = 'sensors'
sensor_id = get_raspid()

# These oversampling settings can be tweaked to
# change the balance between accuracy and noise in
# the data.

sensor.set_humidity_oversample(bme680.OS_2X)
sensor.set_pressure_oversample(bme680.OS_4X)
sensor.set_temperature_oversample(bme680.OS_8X)
sensor.set_filter(bme680.FILTER_SIZE_3)

# print("Polling:")
try:
    while True:
        if sensor.get_sensor_data():

            temp = sensor.data.temperature
            press = sensor.data.pressure
            humi = sensor.data.humidity

            data = {
                'temperature': None,
                'pressure': None,
                'humidity': None,
                'device_id': None,
                'datetime': None
            }

            data['temperature'] = temp
            data['pressure'] = press
            data['humidity'] = humi
            data['device_id'] = sensor_id
            data['datetime'] = datetime.datetime.utcnow().strftime("%Y-%m-%d %H:%M:%S")

            print(data.items())

        response = requests.post(url=(url + "/" + index + "/" + group), data=json.dumps(data))
        try:
            assert response.status_code is 201
        except AssertionError:
            raise AssertionError("Status code error", response.text)
        time.sleep(delay_s)

except KeyboardInterrupt:
    pass
The data from Elasticsearch can be retreived with: http://192.168.178.54:9200/klima/sensors/_search?q=*
{
  "took":74,
  "timed_out":false,
  "_shards": {
    "total":5,
    "successful":5,
    "failed":0},
    "hits":{"total":78,
    "max_score":1.0,
    "hits":[{
      "_index":"klima",
      "_type":"sensors",
      "_id":"D_MKNvRzSTSNqLuMtLbYgw",
      "_score":1.0,
      "_source" : {
        "datetime": "2018-05-19 12:59:13",
        "pressure": 985.51,
        "device_id": "0000000099dd3914",
        "temperature": 26.62,
        "humidity": 39.798}
      }, {
      "_index":"klima",
      "_type":"sensors",
      "_id":"MI2J7VrTQKOiFSKgwNzPPw",
      "_score":1.0,
      "_source" : {
        "datetime": "2018-05-19 13:00:15",
        "pressure": 985.54,
        "device_id": "0000000099dd3914",
        "temperature": 26.69,
        "humidity": 39.548}}]}}
In the end, I stopped working on Elasticsearch because I don’t want to run my 25W NAS server 24/7 just to aggregate some temperatures. Therefore something more lightweight is needed that runs on a RaspberryPi.
Collecting Logs with InfluxDB on a RaspberryPI
I looked into Prometheus and InfluxDB for collecting the data. Both plattforms have their use cases. Finally, an awesome stackoverflow question, where the InfluxDB CEO and a Prometheus developer discussed their plattforms, lead to my decision to go with InfluxDB. Simply because Prometheus is float value only and I want to have multiple datatypes.
Install InfluxDB service on the data collector
Download and install the InfluxDB ARM package:
wget http://ftp.us.debian.org/debian/pool/main/i/influxdb/influxdb_1.1.1+dfsg1-4+b2_armhf.deb
sudo dpkg -i influxdb_1.1.1+dfsg1-4+b2_armhf.deb
Modify influxdb.conf to enable admin GUI and restart the database.
sudo nano /etc/influxdb/influxdb.conf
sudo service influxdb restart
Go to the admin GUI of the InfluxDB and create a new database with the name logger:
# goto: http://localhost:8083/
CREATE DATABASE "logger"
Install the BME680 python package and InfluxDB client on the data sender
You need the bme680 python lib and the InfluxDB client. In my case the bme680 temperature readings are 3.5 degrees celsius to low, therefore I wrote a pull request to allow some offset calculation. Until the pull request is merged you should clone from my bme680 repo.
sudo pip3 install influxdb
git clone https://github.com/ayeks/bme680 -b offset
cd bme680/library
sudo python3 setup.py install
Test InfluxDB client and server
To quickly test your setup you can execute the following script on your data sender.
#!/usr/bin/env python
import time
import datetime
from influxdb import InfluxDBClient
import bme680

# set db configuration
host = "192.168.178.54"
port = 8086
user = "root"
password = "root"
dbname = "logger"

# read sensor data
sensor = bme680.BME680()
temp = sensor.data.temperature
press = sensor.data.pressure
humi = sensor.data.humidity

iso = time.ctime()

# create influxdb client
client = InfluxDBClient(host, port, user, password, dbname)

# create json request
json_body = [
    {
        "measurement": "test",
        "tags": {
            "run": 1,
            "raspid": "raspi1"
        },
        "time": iso,
        "fields": {
            "temp": temp,
            "press": press,
            "humi": humi,
        }
    }
]
print(json_body)

# Write JSON to InfluxDB
res = client.write_points(json_body)
print(res)
In the InfluxDB admin GUI you should be able to read your test values with select * from test. The InfluxDB measurement variable can be compared with a standard relational DB table.
Send everything from the BME680 to InfluxDB
To send everything the BME680 has to your InfluxDB instance you can use my bme680_to_influxdb
script. Clone it with git clone https://github.com/ayeks/bme680_to_influxdb, configure the parameters in senddata.py and execute it with python3 senddata.py. If you want to define a session, location and temperature offset use: python3 senddata.py "dev" "livingroom" -3.5.
Often you want your Raspberry to execute the senddata script automatically after it started. Use the following to do so:
# automated startup:
sudo nano /etc/rc.local
python3 /home/pi/senddata.py "dev" "livingroom" -3.5 &
InfluxDB querying
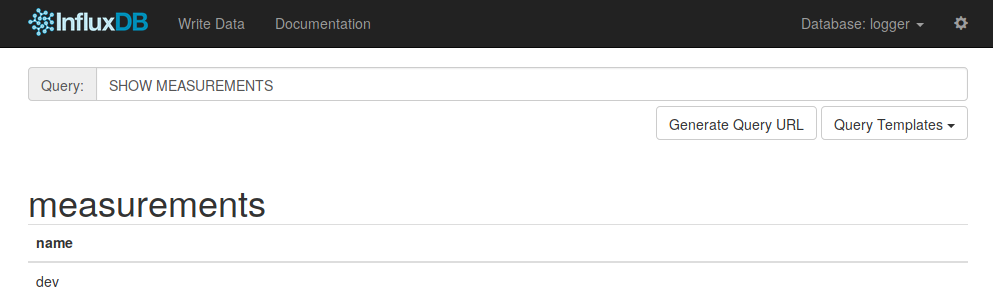
In the InfluxDB admin GUI you can send SQL-like queries. For example you can get all the measurements / tables that exist:
SHOW MEASUREMENTS
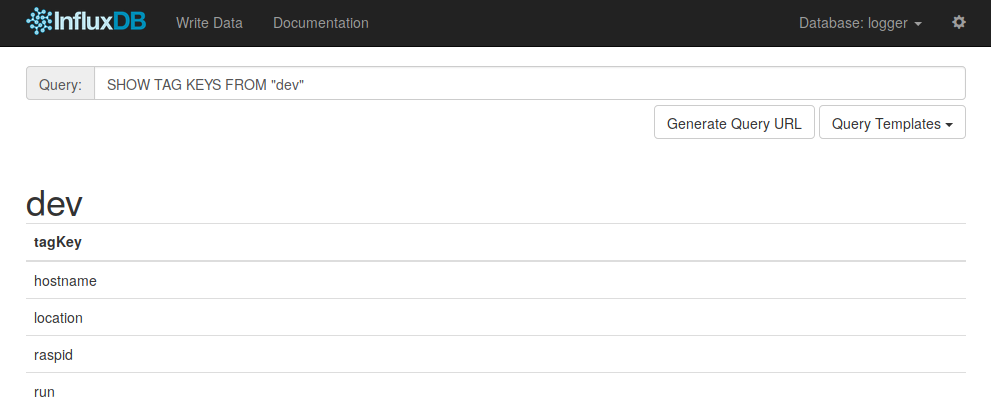
You can also retreive all available tags for a measurement:
SHOW TAG KEYS FROM "dev"
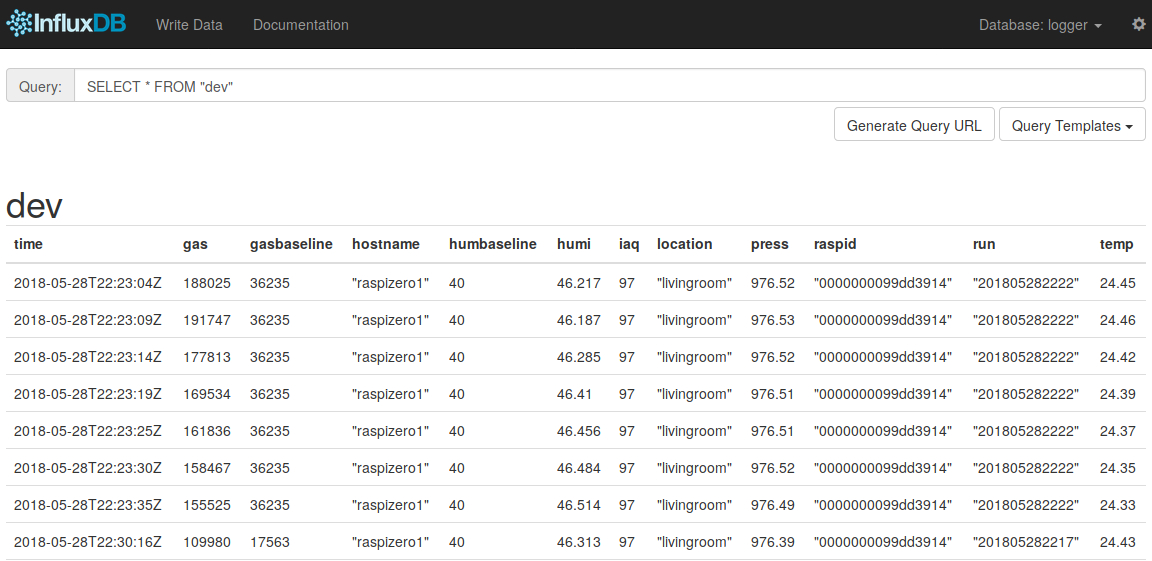
Be carefull when selecting everything because that can take a while to process when the database is big.
SELECT * FROM "dev"
Grafana Dashboards
Having sensor data in a timeseries database is just half the fun of having shiny grafana dashboards for that data. First you need a InfluxDB datasource in your Grafana. Have a look at my configuration.
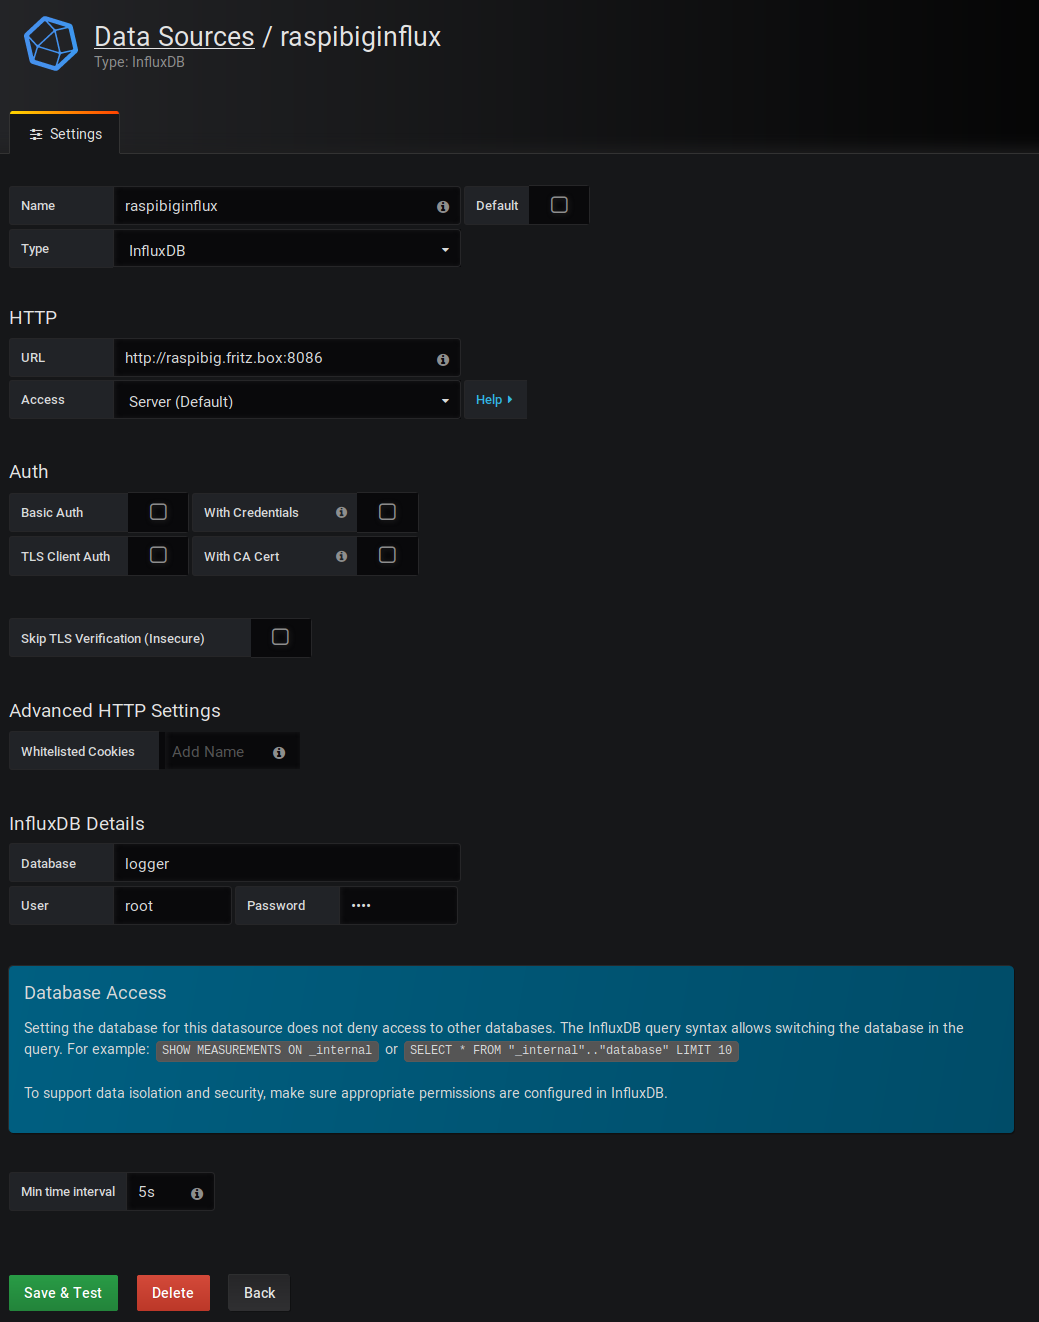
I know, no authorization and isolation is bad. I will get into detail with that in the future.
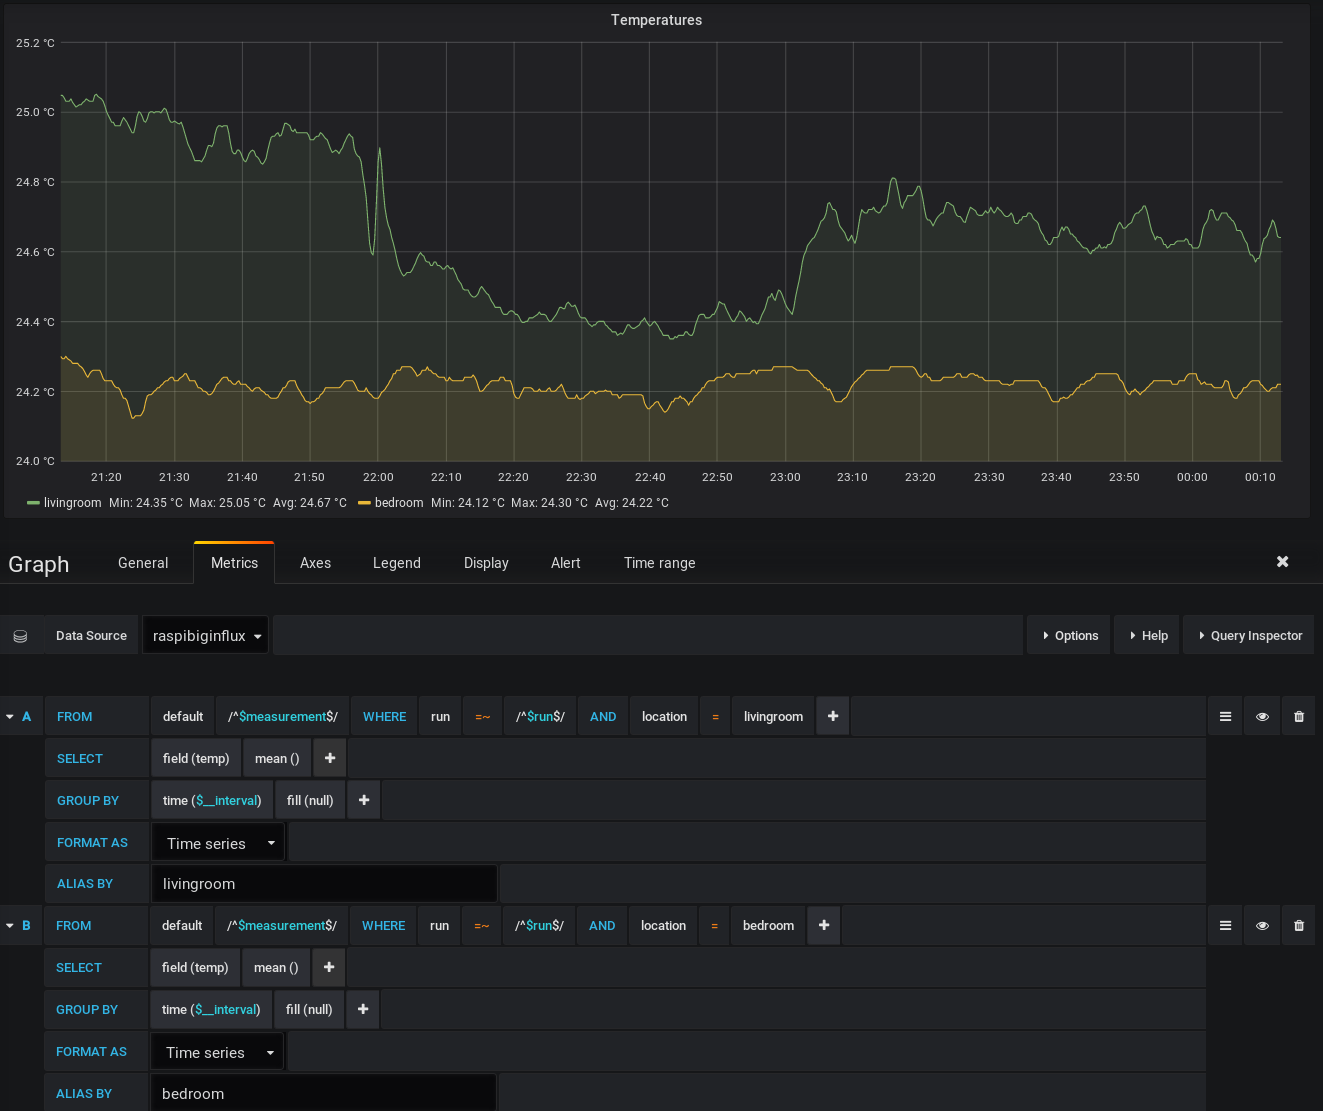
After creating the datasource you can select it when you create a new graph. Simply copy my graph definitions as starting point for your own dashboard:
Currently, the complete dashboard looks like that:
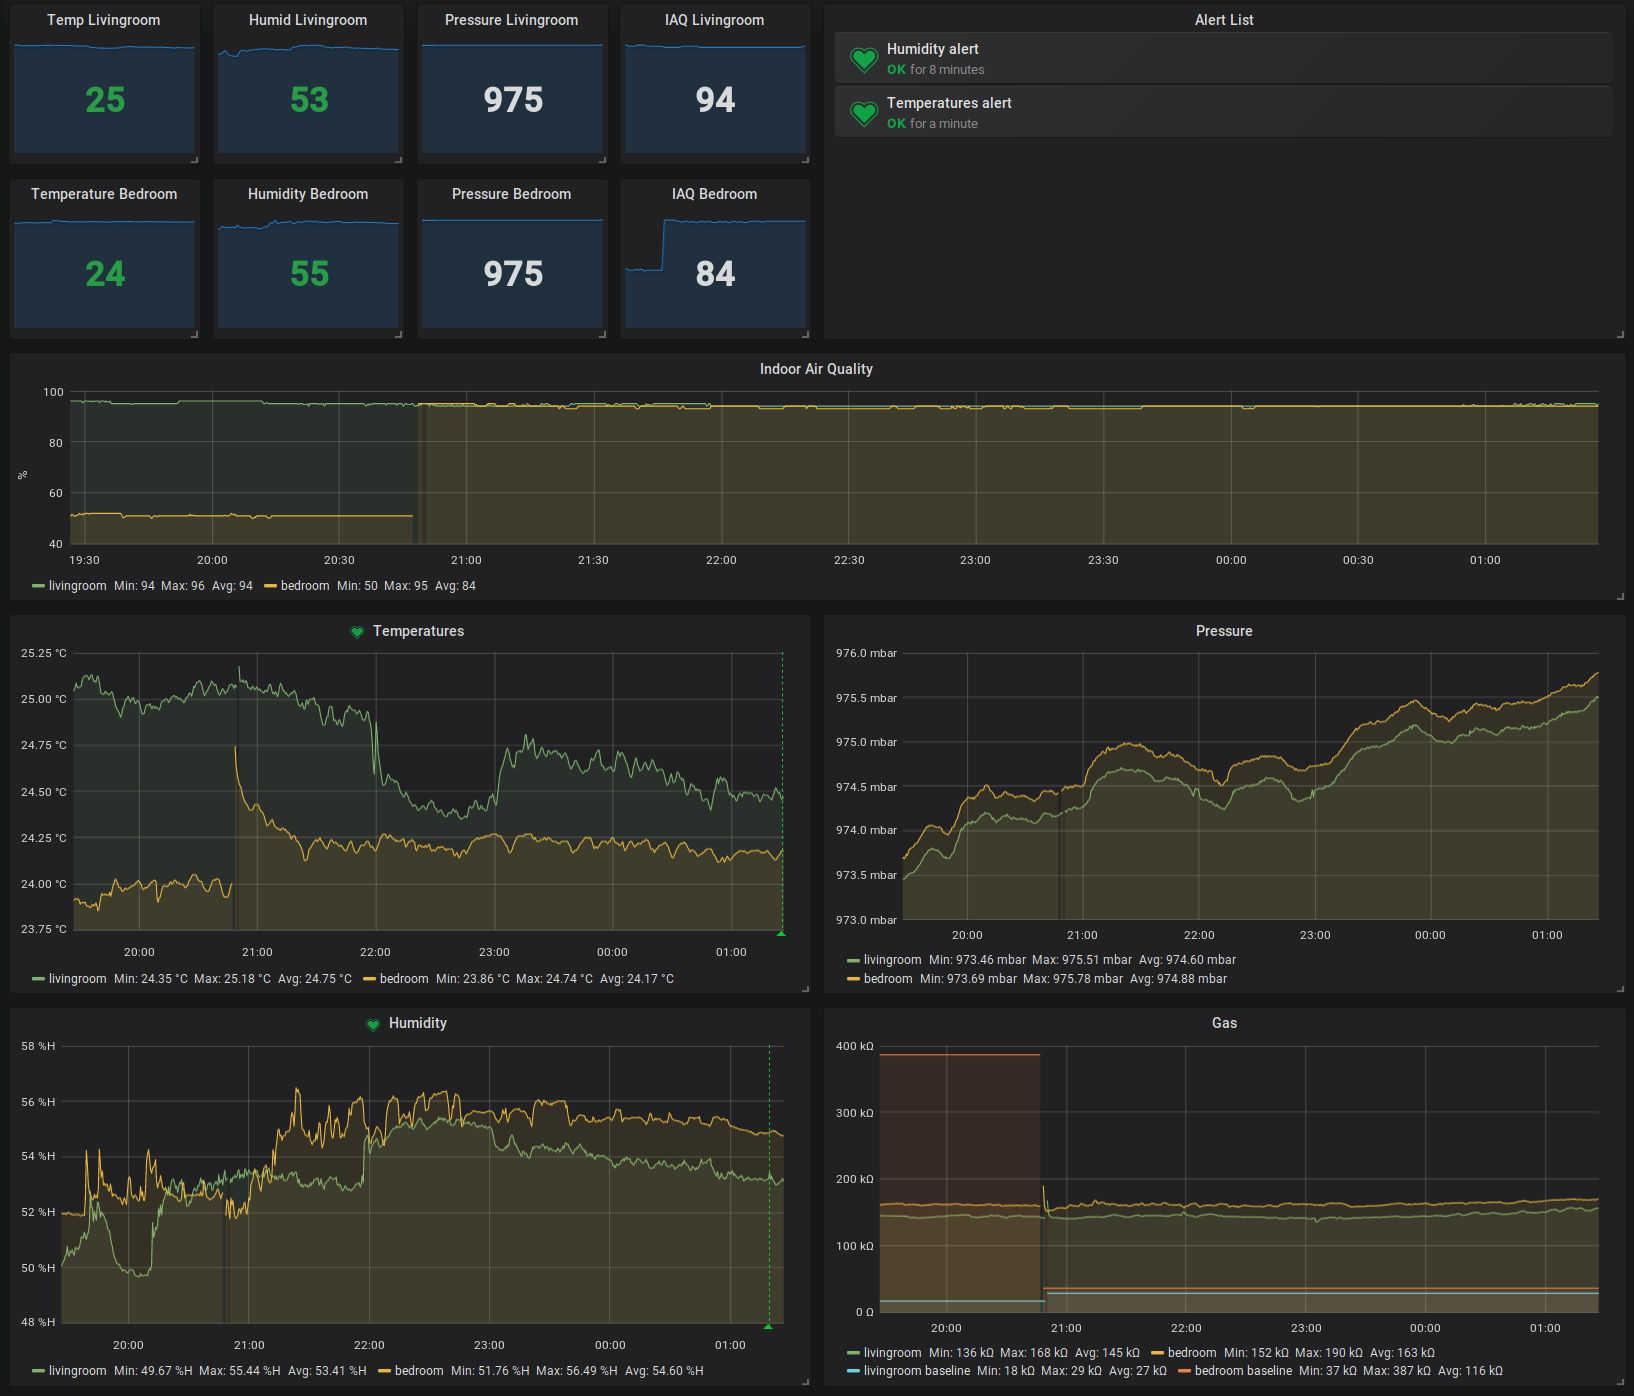
Feel free to download the dashboard from my git repo and feel free to open any issues regarding the senddata.py and the Grafana dashboard.